
Verlässliche Daten über unsere Lebensgrundlage
This publication outlines the concept behind "Biodiversity Monitoring in Switzerland", a project currently being developed by the Swiss Agency for the Environment, Forests and Landscape. The planned method for gathering data in accordance with the OECD's PSR model is explained in detail, with a particular focus on the important role that widespread species play in the collection of biodiversity-related data.
Hintermann, U., Weber, D., Zangger, A., & Schmill, J. (2002). Monitoring de la biodiversité en Suisse. Mémoires de la Société Botanique de Genève 3: 87-102.
Sphaerocarpos texanus wurde in der Schweiz zum erstenmal von Amann und Gams im Jahre 1915 im Unterwallis zwischen Fully und Martigny gefunden (Gams 1927). Später galt dieses interessante Lebermoos in der Schweiz als verschollen und wurde in der Roten Liste (Urmi et al. 1992) als ausgestorben eingestuft, nachdem die mehrfache Nachsuche durch verschiedene Bryologen am alten Fundort von Gams nicht zum Erfolg führte (vgl. auch Population Nr. 124 im Artenschutz-Konzept, Urmi et al. 1996). Allerdings hatte Gams bei der Beschreibung seines Fundortes im Unterwallis absichtlich keine genauen Angaben gemacht, um die Art nicht durch Plünderungen von Raritätensuchern zu gefährden. Trotzdem scheint es aufgrund der erfolglosen Nachsuchen wahrscheinlich, dass der alte Fundort durch die Ausweitung von Rebbergen ins betroffene Gebiet zerstört worden war. Bei der Bestimmung der Moos-Proben aus den diesjährigen Aufnahmen des „Biodiversitäts-Monitoring Schweiz“ (Hintermann et al. 2002) stiess ich nämlich auf einen Beleg von S. texanus, der von Michael Ryff in der Umgebung von Basel gesammelt wurde, von wo die Art bisher nicht bekannt war.
Schnyder, N. (2003). Neufund von Sphaerocarpos texanus Aust. in der Schweiz. Meylania 26: 18-19.
Fissidens celticus J.A. Paton wurde erst 1965 auf den britischen Inseln entdeckt und von Paton 1965 beschrieben. Die Art galt zuerst als endemisch für die britischen Inseln und Irland, bis auf dem Festland ebenfalls Funde gemeldet wurden; Belgien, Frankreich und Deutschland (Frahm 2002, Lecointe et al. 1994, Smith 1987, Vanderpoorten & Sotiaux 2002). Später kamen auch Funde aus Spanien (Cazas et al. 2001) und der Schweiz (Urmi et al. 1996) dazu.
Müller, N. (2004). Überraschend-Fissidens celticus. Meylania 29: 20-22.
The on-going Biodiversity Monitoring in Switzerland Programme (BDM) has monitored vascular-plant species richness since 2001. This long-term programme focuses on two indicators at different spatial scales. First, the local diversity indicator monitors changes of species richness within habitats or types of land use (within-habitat diversity). Second, the landscape diversity indicator is utilized to describe landscape diversity (i.e., within-habitat mosaic diversity). Here we examine if the reproducibility of the BDM methods is sufficiently precise to detect future changes in species richness. We demonstrate that systematic methodical errors are negligible. Random errors that make changes more difficult to detect are also small. We calculate the Minimum Detectable Difference (MDD) for selected BDM strata using the variance of measured values. Then we deduce the MDD values for paired samples using data from grasslands and forests in the Canton Argovia. With 2.4 and 1.6 species they are promisingly precise. We develop a simple scenario for possible changes in species richness and show that they surpass the deduced MDD values by a factor four to six. We conclude that the BDM methods are appropriate for detecting future changes in species richness.
Plattner, M., Birrer, S., & Weber, D. (2004). Data quality in monitoring plant species richness in Switzerland. Community Ecology, 5(1), 135–143. https://doi.org/10.1556/ComEc.5.2004.1.13
Switzerland’s governmental ‘Biodiversity Monitoring’ program is designed to produce factual information on the dynamics of biodiversity within the country for governmental agencies, politicians, and the general public. Monitoring a complex issue like biodiversity in order to give relevant and accurate messages to the general public and politicians within a politically relevant timescale and at moderate cost means focusing on few elements. Because relevant human impacts on biodiversity operate differently at different spatial scales, we need at least three different indicators to observe changes over time in local (‘within-habitat’), landscape (‘habitat-mosaic’), and macro-scale (‘regional’) diversity. To keep things as simple as possible, we use species richness as an indicator for all three levels of diversity, just defining three different spatial scales (10 m2 , 1 km2 , regions, respectively). Each indicator is based on a number of taxonomic groups which have been selected mainly on the basis of costs and the availability of appropriate methods.
Weber, D., Hintermann, U., & Zangger, A. (2004). Scale and trends in species richness: Considerations for monitoring biological diversity for political purposes: Monitoring biological diversity. Global Ecology and Biogeography, 13(2), 97–104. https://doi.org/10.1111/j.1466-882X.2004.00078.x
- Fortschritte in der Floristik der Schweizer Flora (Gefässpflanzen). 69. Folge (Vergleiche des Verbreitungsatlas mit den ersten Daten 2001-2003 des Biodiversitätsmonitoring Schweiz).
- Estimating species richness: Calibrating a large avian monitoring programme: Species richness estimation.
- Biodiversity Monitoring in Switzerland: What can we learn for general surveillance of GM crops?
- Beiträge zur bryologischen Erforschung der Schweiz – Folge 1.
Sonderheft Hotspot
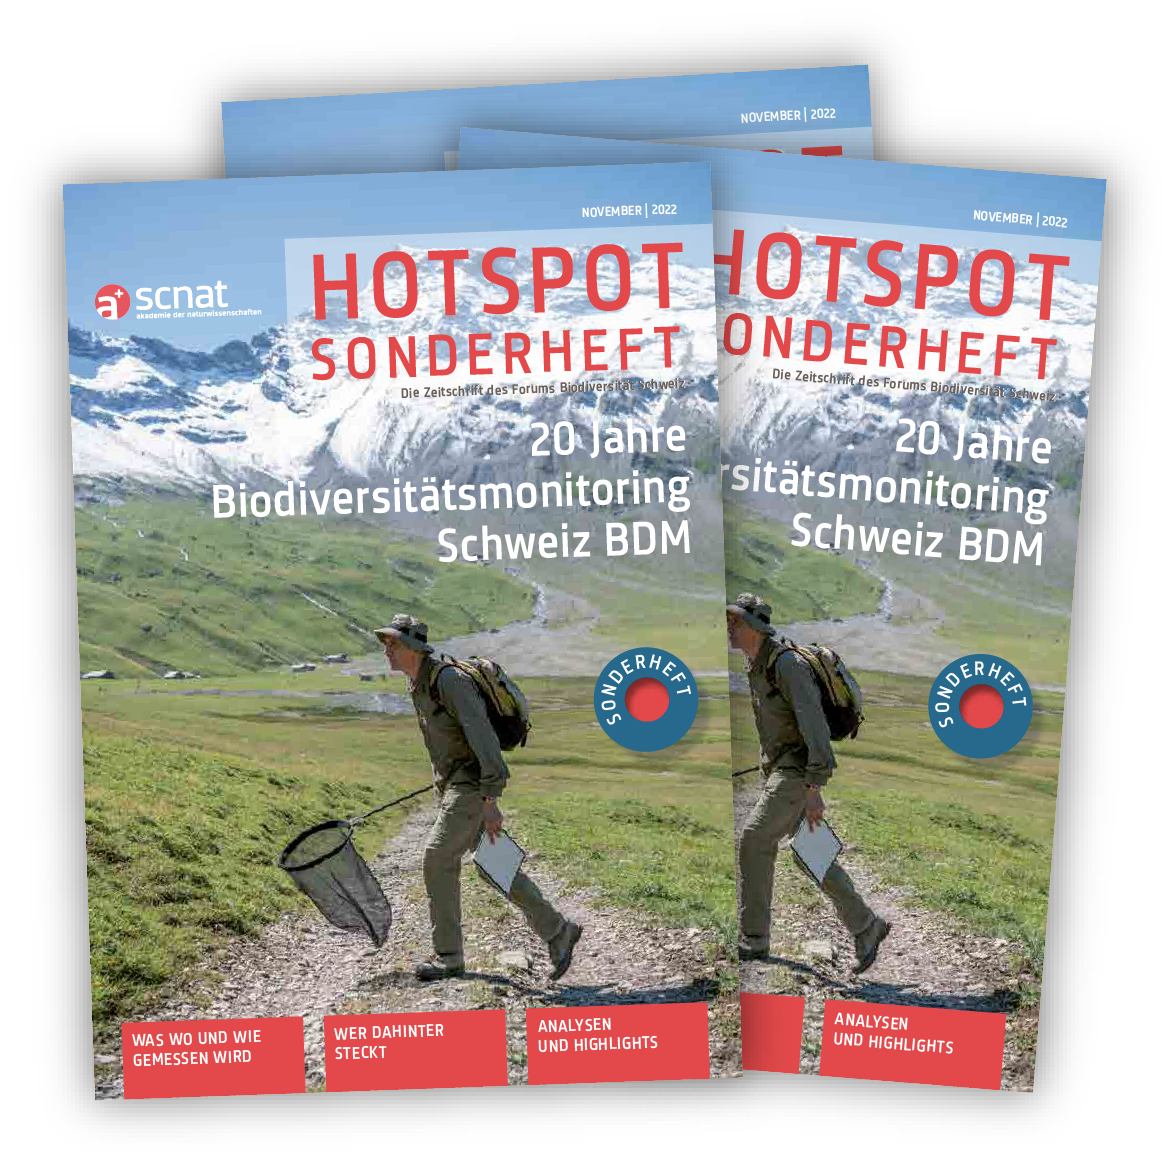
Das Hotspot Sonderheft zu 20 Jahren BDM zeigt, wer hinter den Daten steckt und beleuchtet aktuelle Entwicklungen der Biodiversität.
Publikationen
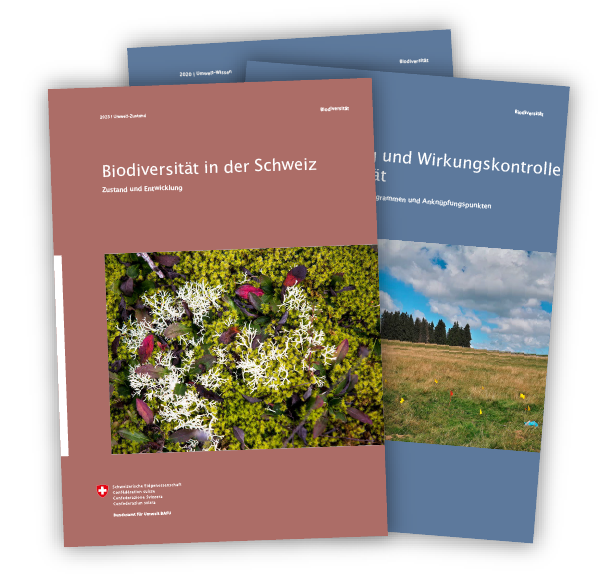
Sammlung aller veröffentlichten wissenschaftlichen Publikationen mit Daten des BDM: